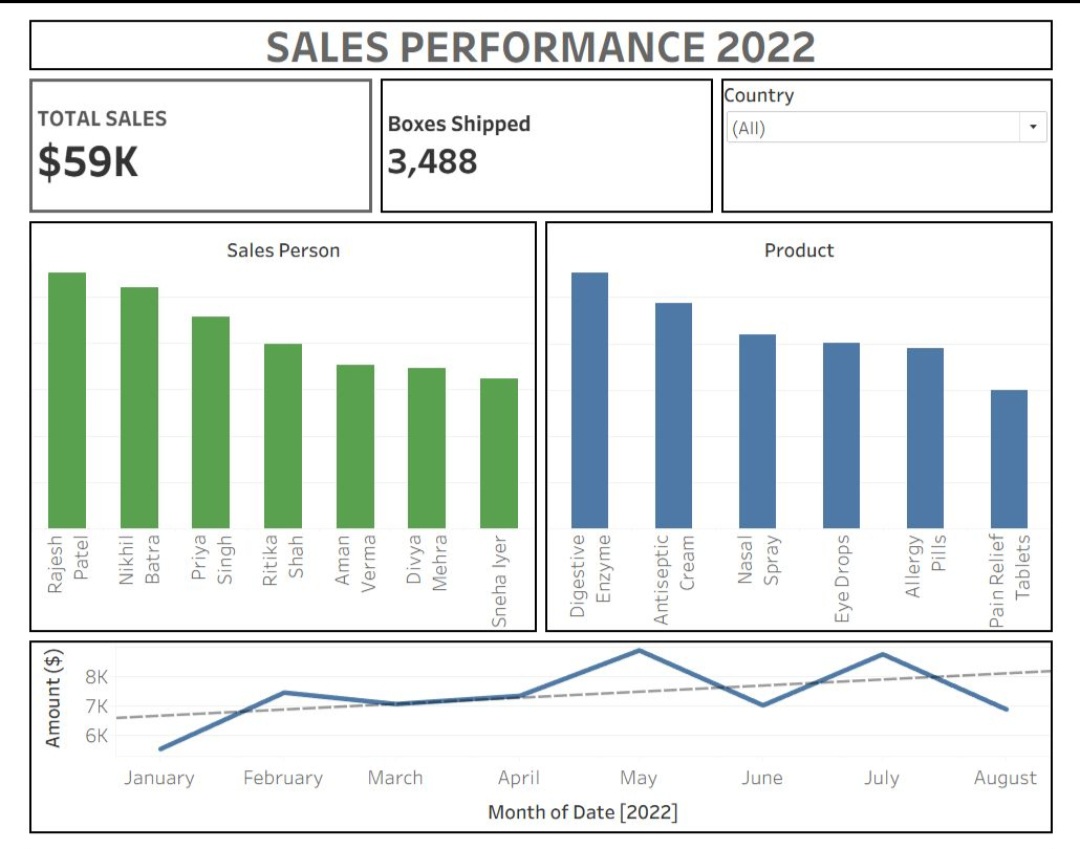
Performed an end-to-end Exploratory Data Analysis (EDA) and created an interactive business intelligence dashboard for a fictitious pharmacy. The goal was to transform raw 2022 sales data into actionable insights for non-technical stakeholders to monitor business health.
Key Objectives & Insights
1. Revenue Analysis: Identified total revenue drivers by analyzing performance across specific products and geographical regions.
2. Personnel Tracking: Evaluated sales performance by individual team members to identify top contributors.
3. Trend Analysis: Conducted a time-series exploration which revealed a consistent positive uptrend in revenue throughout the year.
4. Data Visualization: Designed a high-level executive dashboard to bridge the gap between complex data and managerial decision-making.
By simplifying the workflow in Tableau, I created a centralized view of high-level KPIs—including country breakdowns and sales trends—enabling managers to quickly grasp the state of the business without needing technical data expertise.